
Instagram Reels Get Views but No Followers? Diagnose the Gap
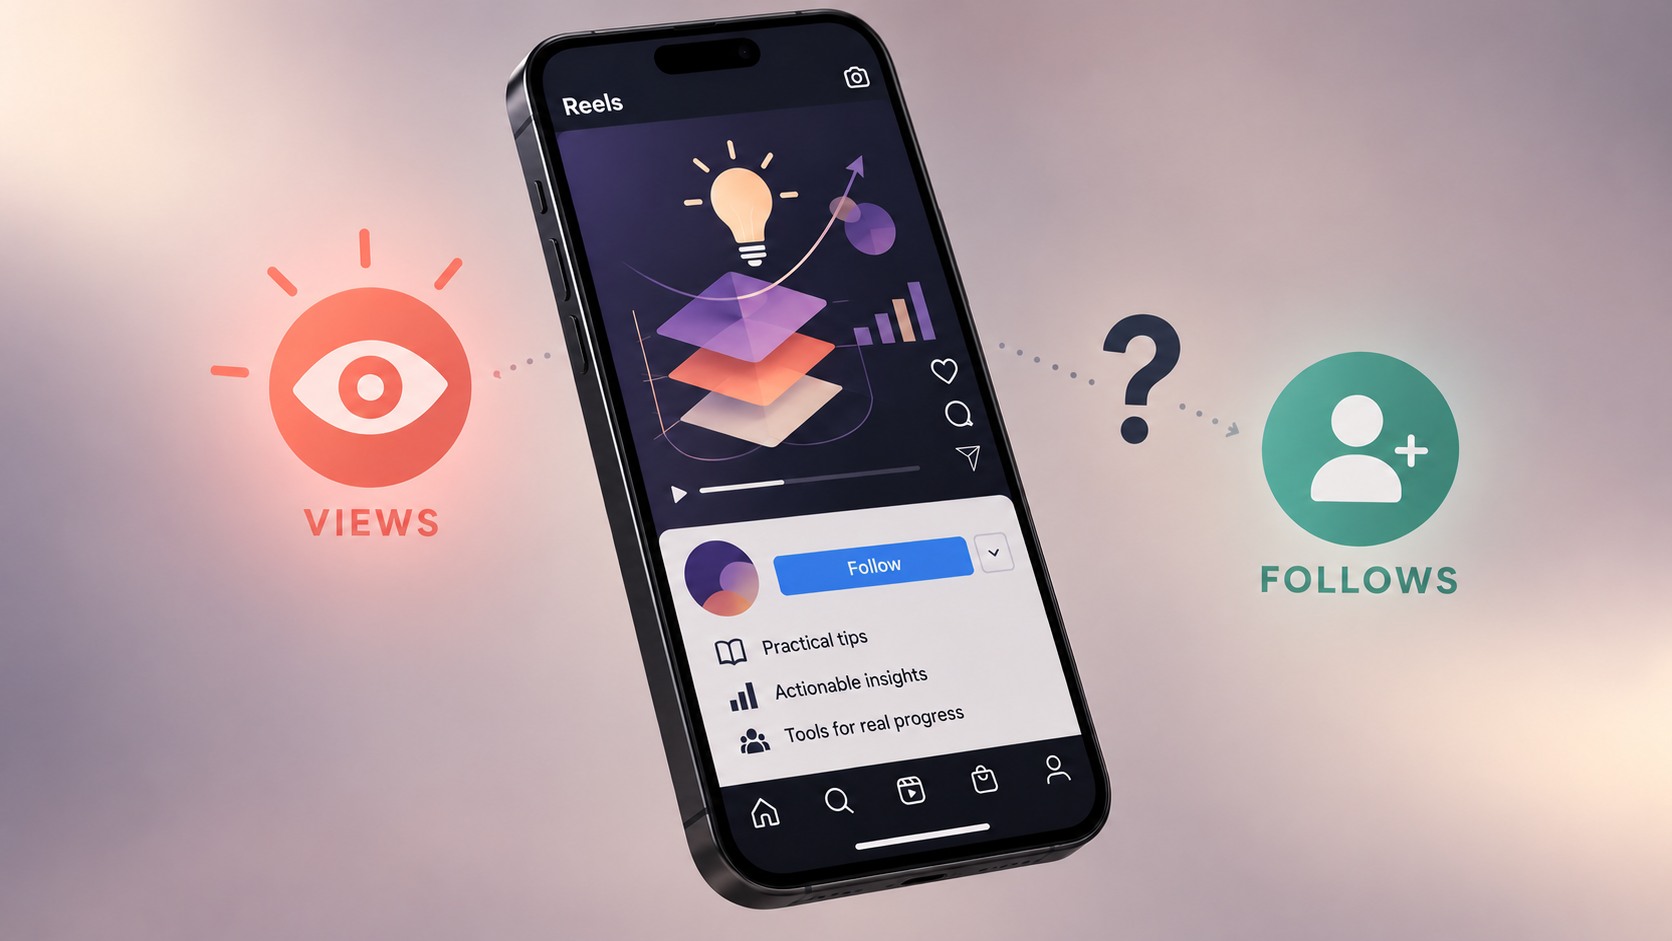
When your Instagram Reels get views but no followers, buying more exposure is not the first thing to try. Start by checking whether the problem is actually low follower conversion, an audience mismatch, or a comparison between numbers that measure different things.
A Reel can be enjoyable without giving someone a reason to follow. Your account can also gain new followers while its net total stays flat. The ten-Reel worksheet below helps separate those situations so your next change addresses the problem you can observe.
First, define “no followers”
There are three different statements hiding inside that phrase:
- This Reel reports no attributable follows. That is a content-level observation, if your account shows the metric.
- My account’s follower count did not rise. That is a net change across the account.
- I cannot find follower attribution. That is missing information, not evidence of zero follows.
Do not substitute one for another. In a simplified fictional example, 40 new follows and 40 unfollows leave the total unchanged. The account still acquired followers. Content-level attribution also cannot be expected to explain every account-level change.
Meta’s 2023 Reels update introduced watch-time reporting and additional information about followers gained from Reels. It supports looking beyond the headline count, but does not prove that every account has identical controls today. Meta’s Reels insights announcement
Record the labels you actually see
Use the available insights for your account and Reel. Labels, breakdowns and access can vary. Save the metric name, its in-product definition where available, the date range and the time you recorded it. Do not change account privacy or account type merely to reproduce a screenshot from an older guide.
Keep these distinctions in your notes:
| Observation | What to check before interpreting it |
|---|---|
| Views or plays | Is this an event count that includes repeated viewing? Which platform’s activity is included? |
| A unique-account or viewer metric | What does its definition count, and does its scope match the view figure? |
| Follows attributed to the Reel | Is this content-level attribution or account-wide follower growth? |
| Profile visits | Are they attributed to this Reel or reported for the entire account? |
| Watch time | Is the figure total time, an average, or another measure? What is its unit? |
| Follower/non-follower breakdown | Does the split refer to views, people or another metric? |
A rate based on views measures something different from a rate based on unique accounts. If repeated plays are included, one person may contribute more than one event. Likewise, account-wide profile visits cannot establish which Reel prompted them.
Where a field is unavailable, write N/A. Use 0 only when the report actually displays zero. If the definition is unclear, record unknown and avoid building a precise rate from it.
Fill in this ten-Reel worksheet
Choose ten recent Reels and compare them at the same age after publication, such as seven days. Seven days is an example observation window, not an Instagram reporting rule. If you cannot recover that historical window, start tracking a new batch of Reels. Lifetime totals from posts of different ages are not a matched comparison.
The worksheet is split into three tables so it stays readable. Keep the same row ID across all three.
A. Content and comparison conditions
Account: ___ Timezone: ___ Chosen observation window: ___
| ID | Reel URL | Published date/time | Topic and format | Distribution: organic / promoted / unknown | Snapshot date/time |
|---|---|---|---|---|---|
| 1 | ___ | ___ | ___ | ___ | ___ |
| 2 | ___ | ___ | ___ | ___ | ___ |
| 3 | ___ | ___ | ___ | ___ | ___ |
| 4 | ___ | ___ | ___ | ___ | ___ |
| 5 | ___ | ___ | ___ | ___ | ___ |
| 6 | ___ | ___ | ___ | ___ | ___ |
| 7 | ___ | ___ | ___ | ___ | ___ |
| 8 | ___ | ___ | ___ | ___ | ___ |
| 9 | ___ | ___ | ___ | ___ | ___ |
| 10 | ___ | ___ | ___ | ___ | ___ |
For mixed paid and organic activity, record “promoted; mixed” unless the report separates the sources. Note major profile changes or cross-platform distribution beside the row.
B. Reach and follower observations
Write the exact label next to each value. Include a non-follower breakdown only if its scope is clear.
| ID | Views: label/value | Unique-account measure: label/value | Non-follower split: label/value | Reel-attributed follows: label/value |
|---|---|---|---|---|
| 1 | ___ | ___ | ___ | ___ |
| 2 | ___ | ___ | ___ | ___ |
| 3 | ___ | ___ | ___ | ___ |
| 4 | ___ | ___ | ___ | ___ |
| 5 | ___ | ___ | ___ | ___ |
| 6 | ___ | ___ | ___ | ___ |
| 7 | ___ | ___ | ___ | ___ |
| 8 | ___ | ___ | ___ | ___ |
| 9 | ___ | ___ | ___ | ___ |
| 10 | ___ | ___ | ___ | ___ |
C. Supporting evidence and confidence
| ID | Shares | Watch time: label, unit/value | Profile visits: scope/value, if shown | Confidence and missing fields |
|---|---|---|---|---|
| 1 | ___ | ___ | ___ | ___ |
| 2 | ___ | ___ | ___ | ___ |
| 3 | ___ | ___ | ___ | ___ |
| 4 | ___ | ___ | ___ | ___ |
| 5 | ___ | ___ | ___ | ___ |
| 6 | ___ | ___ | ___ | ___ |
| 7 | ___ | ___ | ___ | ___ |
| 8 | ___ | ___ | ___ | ___ |
| 9 | ___ | ___ | ___ | ___ |
| 10 | ___ | ___ | ___ | ___ |
Use high confidence for a matched comparison with clear labels, limited for a useful comparison with important omissions, and insufficient when the numbers cannot answer the question. These are worksheet labels, not Instagram ratings.
Separately record the account’s opening and closing follower totals for the overall study period. Add account-wide follows and unfollows if available. Do not assign that net movement to one Reel.
Compare like with like before calculating rates
Group similar topics, lengths and distribution conditions. A promoted giveaway and an organic technical tutorial are poor controls for each other. Even matched organic posts can differ in audience and context, so treat comparisons as clues rather than experiments proving causation.
If both fields are available with compatible scopes, calculate:
Reel-attributed follows per 1,000 unique accounts = attributable follows ÷ unique accounts × 1,000.
If you only have views, you can calculate follows per 1,000 reported views instead. Name that denominator explicitly. Do not compare the two rates as though they measured the same thing, and do not calculate either when the denominator is zero or unknown.
There is no universal follow rate supplied by this worksheet. Your useful reference is your own comparable content, with the same definitions and observation window.
Three fictional diagnoses
These examples are invented to demonstrate reasoning. They are not customer results or tested performance claims.
1. The broad joke attracts the wrong audience
A bookkeeping account’s office joke records 80,000 views, 30,000 unique accounts and 12 attributable follows. A tax-record tutorial records 8,000 views, 5,000 unique accounts and 35 follows in the same window.
Using the fictional unique-account figures, the rates are 0.4 and 7 follows per 1,000 accounts. This suggests a topic-fit question; it does not prove the joke harmed the account.
Next test: Publish another practical tutorial for the same customer type, keeping the presentation style similar. Do not spend to amplify the joke merely because it has the larger counter.
2. The Reel promise and profile promise disagree
A language tutor posts beginner pronunciation lessons, but the bio describes corporate translation. Several comparable Reels generate reported profile visits without many attributable follows.
That makes profile clarity worth testing. It does not prove everyone who followed first visited the profile, or that the bio caused the gap.
Next test: Clarify the bio’s intended audience while keeping the next content batch similar. Use the profile-readiness checklist to check that the bio, pinned content and recurring series make the same promise.
3. Net growth hides acquisition
An account ends the week where it started. Its account-wide report shows 65 follows and 65 unfollows. Some individual Reels show follows; others lack attribution fields.
“No one followed” is the wrong diagnosis. The open question is why acquisition and losses offset each other, and the missing fields prevent a complete content-level explanation.
Next test: Keep recording matched periods and review changes in topic or audience expectations. Do not buy followers to make this measurement problem disappear.
Choose one next action

Text version of this diagram
Record exact labels, definitions and windows; compare similar post ages and distribution conditions. Missing or unclear data remains N/A or unknown, not zero. If attributed follows are low, test topic fit or profile clarity without assuming causation. If follows exist but the account total is flat, examine account-wide losses separately.
| What the evidence shows | Next action |
|---|---|
| High views, unclear audience relevance | Test a more specific topic for the intended follower. |
| Relevant content, unclear continuing value | Make the recurring series and profile promise easier to understand. |
| Paid and organic observations mixed | Separate the reports or collect a cleaner comparison. |
| Missing definitions or incompatible windows | Repair the measurement before diagnosing conversion. |
| Useful acquisition but flat net growth | Examine account-wide losses separately. |
Review the Instagram and Reels service descriptions only after identifying the outcome you need. Any proposed service should explain its method and limitations. More views do not automatically solve a follow decision, and purchased follows are not evidence that your content converted interested viewers.
Sources
Meta’s 2023 Reels insights announcement was checked October 28, 2026. It is historical product context, not a current interface walkthrough. Verify current definitions against the labels and help available in your account before using the worksheet’s optional fields.